Assured Certification
Data Analysis Using Tableau
(Hindi)
Starting at ₹14 Per Day
Select iJaipuria’s Growth Accelerator Plans
Enroll in this course and gain access to 100+
additional industry-relevant courses
__________________ or __________________
Assured Certification
Course Highlights
Course Highlights
- Develop A Profound Understanding Of Tableau's Capabilities And Explore Diverse Data Connection Options For Versatile Analysis.
- Utilize Tableau's Intuitive Visual Analytics To Seamlessly Transform Data, Encompassing Cleaning, Reshaping, And Conducting Insightful Analyses For Impactful Insights.
- Craft Engaging And Meaningful Visual Representations Of Data Through The Creation Of Interactive Charts And Graphs Using Tableau.
- Achieve Mastery In Constructing Interactive Dashboards With Designs That Are Both User-Friendly And Equipped With Dynamic Filters For Seamless Data Exploration.
- Explore Tableau Stories, Dynamic Presentations That Seamlessly Integrate Visualizations, Dashboards, And Annotations To Construct Compelling Data Narratives And Foster A Comprehensive Understanding Of Intricate Datasets.
About the Course

01 hr 40 mins

8 Modules

1 Projects

555 Subscribers

12 Months Access

Assured Certification
Course Structure
- Overview Of Tableau And Its Capabilities Part-1 3:33
- Overview Of Tableau And Its Capabilities Part-2 5:01
- Understanding Data Visualization Concepts 3:23
- Connecting To Data Sources Part-1 1:21
- Connecting To Data Sources Part-2 4:30
- Preparing Data For Analysis 5:20
- Understanding Data Joins & Relationships 5:41
- Demo For Joins 5:09
- Creating Interactive & Visually Appealing Charts, Graphs & Dashboards 9:15
- Working With Different Visualization Types 8:16
- Using Calculated Fields & Table Calculations 4:07
- Implementing Expressions For Custom Data Analysis 5:41
- Visualizing Geographic Data & Creating Maps 3:14
- Utilizing Spatial Analysis Capabilities 5:04
- Applying Filters & Creating Dynamic Interactions 4:29
- Utilizing Parameters For Flexible Reporting 4:20
- Designing Interactive Dashboards & Stories 6:02
- Presenting Data Insights Effectively 14:51
Your Instructor

Vinod H Punjabi
IT Professional
Course FAQs
This course caters to individuals and professionals aiming to elevate their data analysis and visualization skills using Tableau. It’s suitable for business analysts, data analysts, data scientists, managers, and anyone engaged in working with data.
No prior experience is required, although a basic familiarity with Excel and data concepts can be advantageous. The course covers concepts from beginner to advanced levels.
The course provides expertise in Tableau, covering skills in data cleaning, visualization, and interactive dashboard creation. It enhances career prospects, encourages collaboration, and allows remote access to reports through cloud-based features.
Access to Tableau Public is essential as it is a free tool. While having a Tableau license is optional, it proves beneficial for publishing reports to the cloud service.
Certainly! The course emphasizes practical application, and through real-world
projects, you will gain the ability to use your knowledge in real data analysis scenarios.
Upon completing the payment process, you will receive an email confirmation from our team within 5 minutes. You can use your login credentials to access the course on the Dashboard and learn at your own pace and convenience.
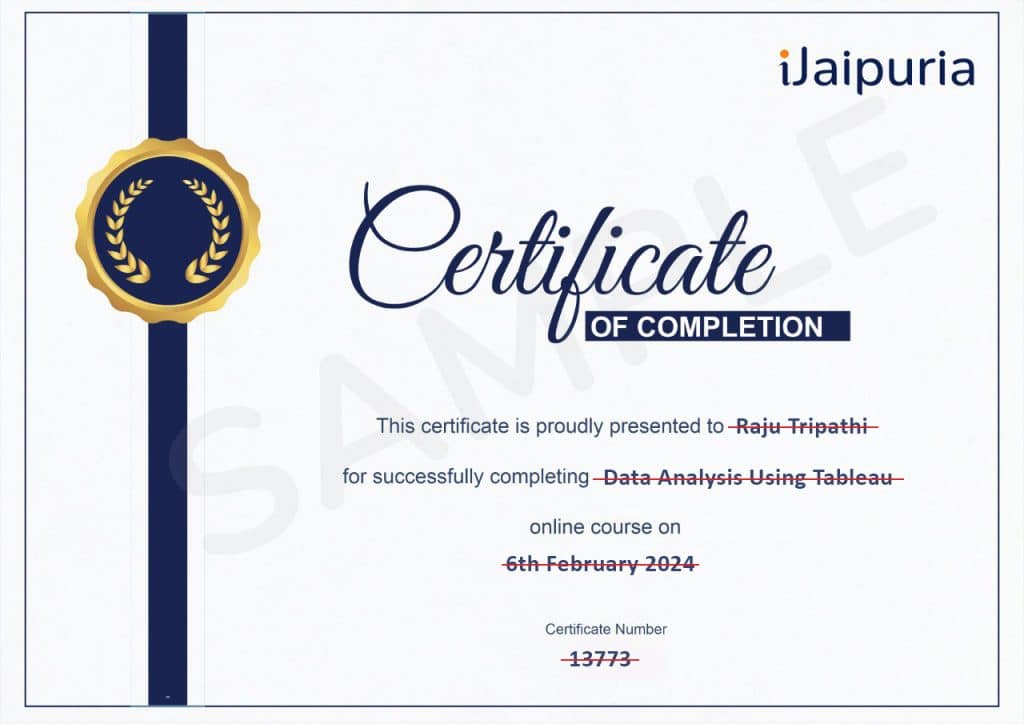
Yes, upon completing the course, you will receive a certificate of completion, which you can download from your Dashboard. The certificate verifies your proficiency in Microsoft Power BI and can be a valuable addition to your resume.
Earn a Certificate
After finishing the course, you will get a Certificate of Completion.
Demonstrate Your Commitment
Be a growth-driven professional and advance your career by learning new skills
Share your Accomplishment
Showcase your verified iJaipuria certificate on your social media platforms and CV

