Assured Certification
MS Excel For Data Science &
Machine Learning
English
Starting at ₹14 Per Day
Select iJaipuria’s Growth Accelerator Plans
Enroll in this course and gain access to 100+
additional industry-relevant courses
__________________ or __________________
Assured Certification
Course Highlights
Course Highlights
- Take Your Data Analysis Skills From Zero to Pro With Excel Pivot Tables
- Learn Everything About Ms Excel and Its Features, From Basic Formulas to Using Advanced Stuff for Data Analysis
- Master the Concepts of Creating Table, Pivot Table, Power Pivot, Power Query, Data Analysis Add-ins and Many More
- Learn How to Use Ms Excel for Data Visualisation, Exploratory Data Analysis, Linear Regression Model Building and Many More
About the Course
- Why learn MS Excel for Data Analysis and Data Science.
- What are the pros and cons of using MS Excel for Data Analysis & Data Science
- Limitations of using MS Excel in Data Science & Data Analysis
- Raw data structure in Excel
- How to do ETL in MS Excel
- Pivot Table layouts & styles
- Design & formatting options
- Sorting, filtering, & grouping tools
- Calculated fields, items & values
- EDA for Data Analysis
- Data Visualization
- Data Modelling.
- Linear Regression in MS Excel

02 hrs 47 mins

15 Lessons

Q&A

12 Month Access

231 Subscribers

Assured Certification
Topics You Will Learn in This Course
- Raw Data Structure in Excel
- Basic Functions: SUM, AVERAGE, PRODUCT, COUNT, COUNTA, COUNTBLACK, COUNTIF, SUMIF, AFVERAGEIF, SUMPRODUCT
- Intermediate Level Actions: IF, Text Functions, Date, Time Functions, Statistical Functions, Reference Functions
- Data Analysis Tools: Quick Analysis, Tables, Pivot Tables
- Advanced Level Actions: Importing External Data, Use of Data Analysis Add In, Data Validation, Create Your Own Dictionary in Any Language
- Pivot Table Layouts & Styles
- Design & Formatting Options
- Sorting, Filtering, & Grouping Tools
- Calculated Fields, Items & Values
- Pivot Charts, Slicers & Timelines
- Interactive Excel Dashboards
- Advantages & Limitations of Excel
- Descriptive Statistics Analysis
- Machine Learning With Excel
- Linear Regression
- Data Visualizations
- Exploratory Data Analysis
- Real-world Pivot Table Case Studies
- Median, Quartile, Percentile
- Correlation & Covariance
- Advanced Formulas for Data Science
- Power Query
- Data Modelling
Course Structure
- Introduction to the Course 06:36
- Concept: Introduction to MS Excel 06:27
- Mindset: Why To Learn MS Excel For Data Science & AI 08:15
- Tour To MS Excel 06:05
- Basics Of MS Excel 14:28
- Intermediate Level Of MS Excel 19:19
- Advanced Level Of MS Exce 11:24
- Practice & Exercise and Important Resources 04:12
- Data Visualization In MS Excel: Types of Charts 02:49
- Data Visualizations In MS EXCEL-Part 1 12:24
- Data Visualization In MS EXCEL-Part 2 03:43
- EDA Hands On Tutorial In MS Excel-Part 1 17:42
- EDA Hands On Tutorial In MS Excel-Part 2 07:33
- Linear Regression: Fundamentals 23:26
- Limitations Of Machine Learnings With MS Excel 02:09
Your Instructor

Sachchidanand Kumar
Data Science & AI ExpertCourse FAQs
MS Excel is not just a spreadsheet, but a very powerful analytical tool highly used across all the industries ranging from the finance sector to the manufacturing sector, from the IT sector to Data Science & AI field.
MS Excel is good for Data Modelling and building a Linear Regression Model and that too with not a huge Data Set. But if you want to build some advanced ML Models using advanced algorithms, it is not recommended, rather you need to use some Programming Languages like R, Python, and Scala which have inbuilt powerful machine learning libraries.
MS Excel can be used for lots of Data Analysis & Data Science activities, you can even leverage the power of Power Query, DAX Expressions, and advanced formulas for detailed and advanced levels of Analysis.
Some of the data analysis activities include but are not limited to operations like ETL (extraction, Transformation & Loading of data in Power Query, Preprocessing of Data, EDA (Exploratory Data Analysis), Data Visualizations, Data Modeling, Advance Statistics, Data Analysis with the help of some Add-Ins, Optimization using Solver Tools and many more.
Inherently MS Excel is built for analyzing not-so-big data, but you can leverage the power of Power Query which is available in the latest versions (beyond 2016 ) in MS Excel and can help you to carry out a detailed analysis in MS Excel itself even if you have Big Data
MS Excel comes with lots of features and tools, which may sometimes be overwhelming, but luckily you can master these features and know all the tools with proper guidance and consistent practice.
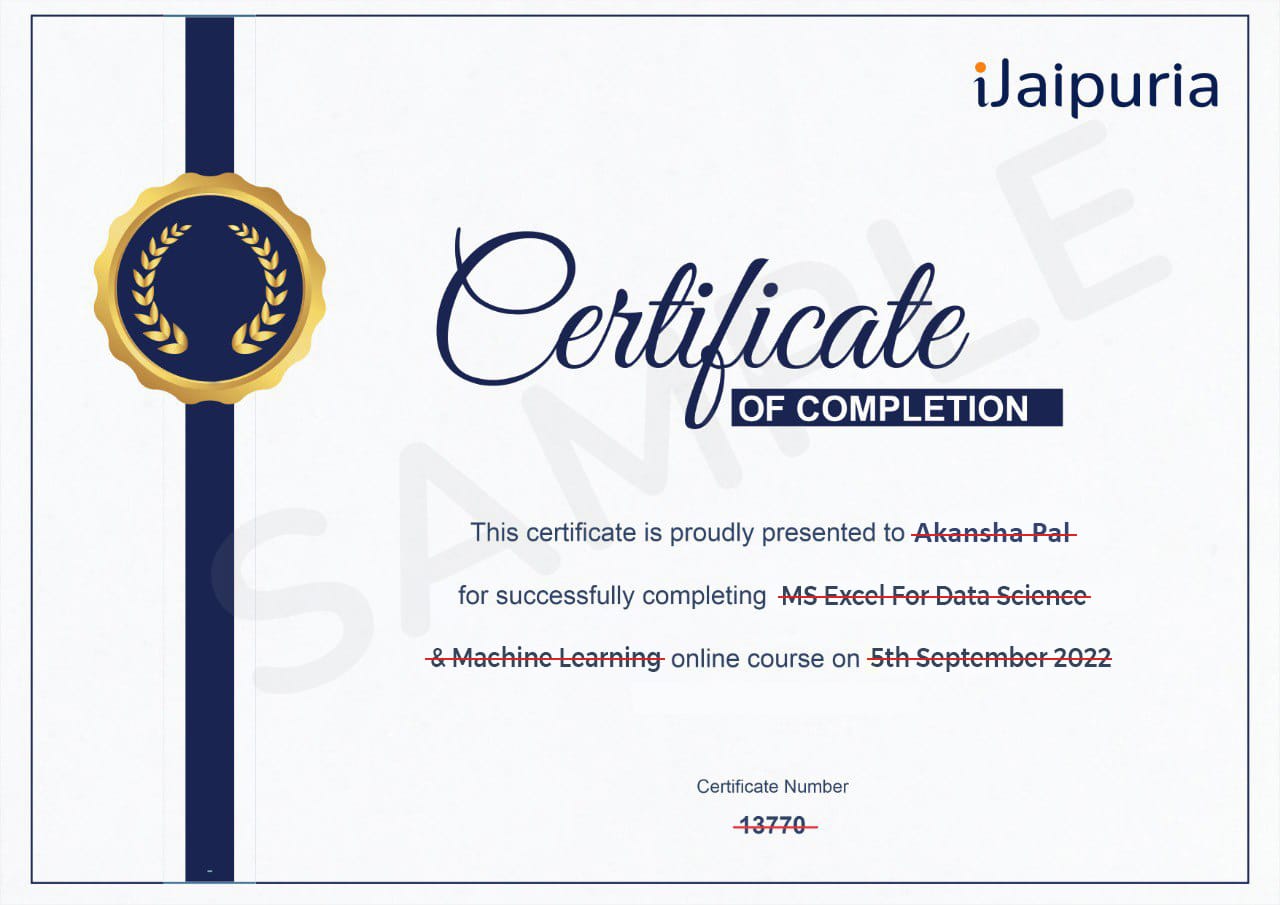
Earn a Certificate
After finishing the course, you will get a Certificate of Completion.
Demonstrate Your Commitment
Be a growth-driven professional and advance your
career by learning new skills
Share your Accomplishment
Showcase your verified iJaipuria certificate on your social media platforms and CV

