Assured Certification
Data Analysis Using Tableau
(English)
Starting at ₹14 Per Day
Select iJaipuria’s Growth Accelerator Plans
Enroll in this course and gain access to 100+
additional industry-relevant courses
__________________ or __________________
Assured Certification
Course Highlights
Course Highlights
- Gain A Thorough Overview And Introduction To Tableau, Including A Deep Dive Into The Tableau Environment And Its Various Components.
- Explore The Different Types Of Visualisations Available In Tableau And Their Applications, Enabling You To Choose The Most Effective Chart Types For Different Data Scenarios.
- Learn How To Effectively Use Tableau Through Practical Exercises, Allowing You To Build Confidence And Proficiency In Creating Visualisations And Dashboards.
- Dive Into Advanced Functions And Techniques In Tableau, Empowering You To Perform In-Depth Data Analysis, Identify Trends, And Extract Valuable Insights From Your Data.
- Understand The Application Of Tableau In Real-World Scenarios, Such As Analysing Attrition Rates, Visualising HR Data, Conducting Department-Wise Analysis, and Providing You With Practical Knowledge To Solve Data Challenges.
- Discover The Art Of Designing Visually Appealing And User-Friendly Dashboards, Including Formatting Tips, Storytelling Techniques, And Dashboard Design Best Practises, Ensuring Your Visualisations Effectively Communicate Data-Driven Narratives.
About the Course

03 hrs 20 mins

9 Modules

2 Assessments

12 Months Access

825 Subscribers

3 Handouts
Course Structure
- Tableau Overview 18:31
- Understanding The Tableau Environment 13:43
- Types Of Visualisations And Their Applications 13:05
- How To Use Tableau? 10:11
- Types Of Charts In Tableau 16:56
- Functions Overview 8:10
- Data And HR Dashboard Use Case Scenario Understanding 5:33
- Relationships And Joins 5:22
- Visualising Attrition Rate And Active Employees 6:17
- Creating Custom Charts 8:19
- Adding Filters 3:57
- Visualising More KPIs Number Of Employee By Age Groups 6:02
- Job Satisfaction Rating 5:42
- Age & Gender Wise Analysis 9:13
- Conditional Formatting 4:46
- Department Wise Attrition Analysis 3:55
- Dashboard Designing And Formatting Tips 5:52
- Finalising Dashboard Formatting 4:48
- Presenting The Dashboard In A Story 13:55
- Dashboard Designing Best Practices Part 1 13:47
- Dashboard Designing Best Practices Part 2 10:55
- Dashboard Designing Best Practices Part 3 12:42
Your Instructor

Deepesh Vashistha
Microsoft Certified Data Engineering Specialist
Course FAQs
No, prior experience is not required. The course caters to learners of all levels, including beginners.
You will need access to Tableau Desktop, which can be downloaded as a trial version from Tableau’s official website.
By completing this course, you’ll gain enhanced data visualisation skills, making you a valuable asset in the job market. Employers increasingly rely on data-driven decision-making, and your ability to create impactful visualisations will set you apart from competitors and open doors to new career opportunities.
Absolutely! The advanced data analysis techniques and practical experience gained through the course will empower you to make informed decisions and provide valuable insights for your organisation. This can lead to career advancement opportunities within your current job.
Yes, Tableau proficiency is highly sought after by employers across various industries. The ability to analyse data and present compelling visual narratives is a valuable skill that organisations look for in professionals to drive data-driven growth.
Yes, the Tableau Mastery Course incorporates real-world use cases, including scenarios from HR. You’ll gain industry-relevant knowledge and practical skills to tackle data challenges specific to these sectors.
Upon completing the payment process, you will receive an email confirmation from our team within 5 minutes. Then, you can use your login credentials to access the course on the Dashboard, where you can learn at your own pace and convenience.
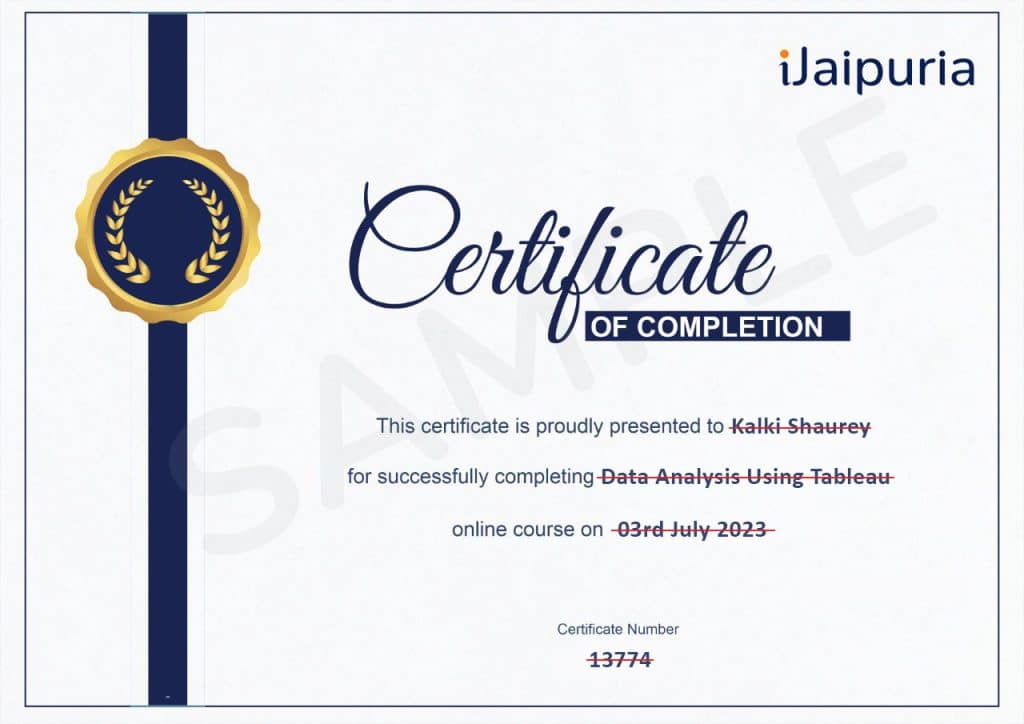
Upon completing the course, you will receive a certificate of completion, which you can download from your Dashboard.
Earn a Certificate
After finishing the course, you will get a Certificate of Completion.
Demonstrate Your Commitment
Be a growth-driven professional and advance your career by learning new skills
Share your Accomplishment
Showcase your verified iJaipuria certificate on your social media platforms and CV

